# 3. Website Interface
# 3.1. Widget System
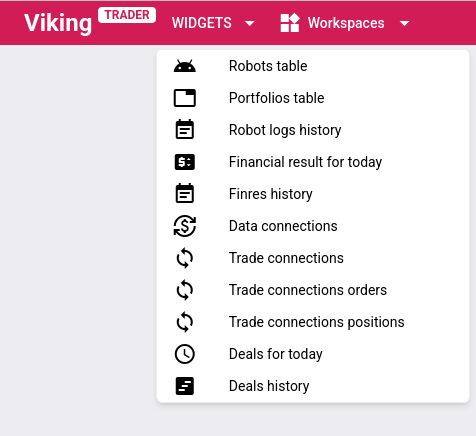
The main interface page consists of a set of widgets. Most widgets are based on tables, while others are built around charts. Table-based widgets can be opened via the Widgets dropdown menu. Chart-based widgets can only be opened using a dedicated button in another widget. Table-based widgets can be opened and closed in any number, order, and quantity, except for the Robot logs widget, which is always open and available as a single instance. No more than 10 chart widgets can be open simultaneously. The site is available in both desktop and mobile (smartphone-optimized) versions. All descriptions in this chapter apply to both versions unless otherwise specified. In the desktop version, widgets can be moved within the browser window and resized. In the mobile version, only one widget is displayed at a time, occupying the full browser window; other widgets exist as tabs that can be switched between.
 |
|---|
| Fig. 1 |
Note that all widgets are customizable. Column order can be changed, column widths adjusted, and unnecessary columns hidden via the Columns tab. It is possible to open multiple instances of the same widget with different settings. A configured workspace can be saved in Workspaces and later restored on other devices. Workspace export and import via file are also supported, allowing users with multiple roles to transfer their configured Workspaces from one role to another.
# 3.1.1. Controls of Table-Based Widgets
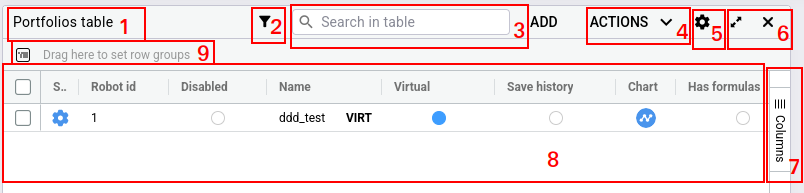
All table-based widgets share common features. Their control elements have a uniform appearance across all widgets. We will examine them using the Portfolios table widget as an example.
 |
|---|
| Fig. 2 |
Let us detail the interface elements of the widget marked with numbers in Figure 2. Certain interface elements may be absent in specific widgets if they are not applicable to that widget’s content. Additionally, the top bar of a widget may contain extra controls unique to that particular widget; such controls will be described separately for each widget.
- Widget title. Besides the widget name, it may include additional information, such as the robot number for widgets displaying data for a specific robot. In the desktop version, the widget can be dragged and moved within the page by its title bar.
- Filter. Available only in the
Portfolios tablewidget, it allows hiding portfolios that do not meet the filter criteria. Portfolio filtering is performed directly on the server; only portfolios matching the filter conditions are sent to the website. Initial filtering is recommended to be done via this filter, as—unlike the search bar—it reduces the amount of data transmitted over the network, improving interface responsiveness. Filtering is case-insensitive, meaning uppercase and lowercase letters are treated identically. - Search bar. Enables filtering of data already loaded into the table. Search is case-insensitive.
- Actions list. Applies actions to selected table items. This may appear as a standalone item or be hidden under the gear icon in item 5.
- Widget settings. May also contain a list of actions applicable to selected table items.
- Widget window controls: buttons to maximize the widget to full workspace area and close the widget.
- Column visibility control. This menu allows disabling display of table columns whose values are not of interest.
- Widget body. Represents the data table. Table capabilities will be described further.
- Row grouping helper. To enable row grouping by values in a specific column, simply drag and drop the desired column header onto this label using the mouse or finger.
# 3.1.2. Table Features
 |
|---|
| Fig. 3 |
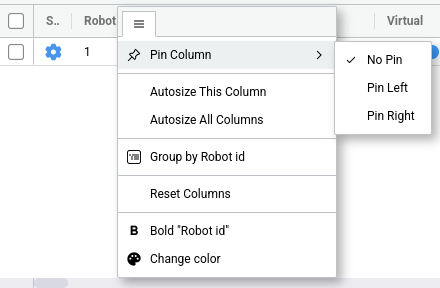
Access to most table functions is provided either through the widget controls described above or via the column headers. Clicking a column header triggers sorting. Hovering over a column header reveals a menu button; the open menu appears as shown in Figure 3. To enhance data visibility, conditional color highlighting may be applied to values in specific columns across different widget tables when certain conditions are met (for example, when few days remain until license expiration). Additionally, if insufficient data is available for a value calculation, an exclamation mark will appear next to the cell value (a common case being a portfolio field that cannot be computed because the market data connection is offline).
- Sorting - sorting table rows based on values in a specific column..
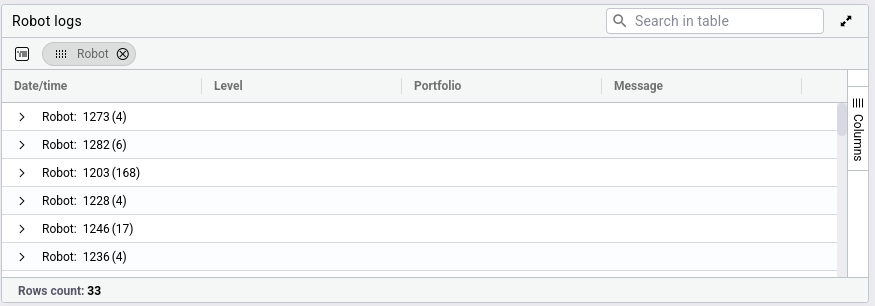
- Grouping - grouping table rows by values in a specific column. An example of grouping by the
Robotcolumn is shown in Figure 4.
 |
|---|
| Fig. 4 |
- Column pinning - locking a column to the left or right side of the table. Such a column remains visible during horizontal scrolling. Columns that uniquely identify a row—such as robot ID or portfolio name—are typically pinned. Multiple columns can be pinned simultaneously.
- Auto-resize column width - automatically adjusting the column width to fit the content of all table rows.
- Bold text - applying bold formatting to all values in the selected column.
- Color change - changing the text color of all values in the selected column.
# 3.1.3. Chart Features
 |
|---|
| Fig. 5 |
Charts are built on the TradingView platform, so a wide range of TradingView tools are available: chart zooming and scaling, drawing additional lines and indicators, changing line and background colors, and many other features.
# 3.1.4. Widget State Persistence
Using the Workspaces menu, you can save the current workspace configuration. This saves the state of widgets (whether a widget is open or closed, position on the workspace for open widgets), table states (column widths, column visibility settings, sorting, grouping, etc.), chart states (selected instruments, indicators, additional lines, time scale for historical charts, etc.), and any filters applied to the portfolios table. Up to 10 workspaces can be saved. A saved workspace can later be loaded to restore your preferred working environment on another device. Saved configurations can be updated, deleted, or exported to a file for subsequent import. Exporting to and importing from a file allows users with multiple roles to transfer configured Workspaces from one role to another.
# 3.2. Widget Overview
The website uses a user role system. Different widgets may be available depending on the role, and widget content can also vary — some table columns available under one role may be missing under another. The following descriptions will reflect how widgets appear to a user with the Trader role. Widgets available under this role are described below.
# 3.2.1. Robot logs
This widget displays important log entries from all robots accessible to the user. Logs in this widget accumulate starting from the last page reload. Not all log messages are shown—only those requiring attention, such as errors and warnings. This widget cannot be hidden. It is intended for real-time display of critical messages; due to a limited number of stored messages, for searching or reviewing older logs, please use the Robot logs history widget. The widget is always present as a single instance.
The main table in the widget includes the following columns:
- Date/Time - date and time when the event occurred, displayed in the user’s local time according to the device's time zone;
- Level - logging level;
- Robot - robot identifie;
- Portfolio - portfolio name;
- Message - message text;
# 3.2.2. Robots
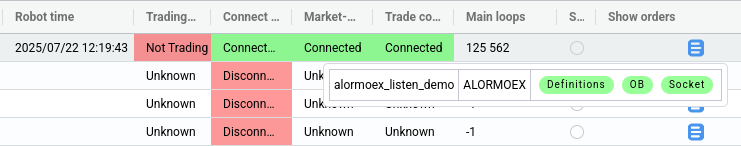
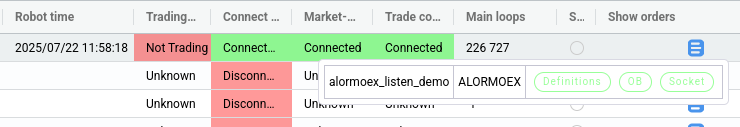
A widget displaying a list of available robots along with reference information about them. For example, this widget shows how many days remain until license expiration or how many trading connections can be created in a specific robot. It also displays the local server time for the server on which the robot is running—this time should be used as a reference when setting schedules.
The main table of the widget contains the following columns:
- Robot ID - robot identifier; this should be included when contacting support regarding issues with the robot;
- Name - robot name, essentially a label for easier identification, which can be modified by support staff or the
Head of traders; - Company - name of the company to which the robot belongs;
- Days paid - number of remaining paid days according to your license;
- Robot time - local time of the server where the robot is running;
- Connection limit - maximum number of trading connections that can be added to the robot according to your license;
- Process status - status of the robot’s main process, indicating whether it is running or not;
- Trading status - trading state of the robot; the robot is considered to be trading if trading is active in at least one of its portfolios. Hovering over this status displays a tooltip showing detailed information on whether each portfolio is currently trading;
- Connect to back - status of the robot’s connection to the backend control server, which aggregates data from all robots for delivery to the website or via API;
- Market data - status of the robot’s market data connections. Possible statuses:
Connected- displayed only when all market data connections are online or disabled by schedule (this ensures the cell remains green, as both "connected" and "disabled by time" are normal operational states). Examples of these two cases are shown in Figures 6 and 7 below;
 |
|---|
| Fig. 6 |
 |
|---|
| Fig. 7 |
Disconnected- displayed only when all market data connections are offline;Connecting- displayed when some market data connections are online and others are offline; hovering over this status shows a tooltip with detailed information about the state of each market data connection;
- Trade connection - status of the robot’s trading connections. Possible statuses:
Connected- displayed only when all trading connections are online or disabled by schedule;Disconnected- displayed only when all trading connections are offline;Connecting- displayed when some trading connections are online and others are offline;
hovering over this status shows a tooltip with detailed information about the state of each trading connection;
- Production transactions count - total number of trading transactions (order placements, cancellations, re-quotes) sent during the day across all live (non-
Virtual) connections of the robot. The value resets daily at 5:40 server time. Hovering over this field displays a tooltip with detailed transaction counts per connection; - Virtual transactions count - number of trading transactions (placements, cancellations, re-quotes) executed within the
Virtualconnection (i.e., without actual transmission to any exchange) during the day. The value resets daily at 5:40 server time; - Version number - version number of the binary file currently running for the robot. If it differs from
Server version number, the field is highlighted in yellow; - Version date - date of the latest changes in the source code included in the currently running robot binary;
- Server version number - version number of the binary file uploaded to the server and used when restarting the robot. Thus, upon restart, the robot always updates to the latest available version on the server. If it differs from
Version number, the field is highlighted in yellow; - Server version date - date of the latest changes in the source code included in the robot binary uploaded to the server and used upon restart.
# 3.2.3. Portfolios table
A widget displaying a table of portfolios. This is essentially the main widget used during trading. New portfolios are created, old ones deleted, and existing portfolio parameters modified through this widget. The ADD button is used to create new portfolios. The ACTIONS menu contains operations that can be performed on one or multiple portfolios. A description of portfolio actions is available here. Column values in the table correspond directly to portfolio parameters.
# 3.2.4. Robot logs history
A widget displaying logs for a specific robot over a defined time period. It displays a maximum of 100,000 entries at a time. Therefore, if you need to view log history over a long period, you should split that period into several shorter periods when querying data in this widget. Log filtering by keywords is supported; for example, you can use a portfolio name or trading connection name as a keyword. This widget includes all log entries accessible to the user. Exporting the table contents to a file is supported. According to the system update of June 22, 2025, the retention period for historical data is 6 months.
The main table of the widget includes the following columns:
- Date/Time - date and time when the event occurred, displayed in the user’s local time according to the device's time zone;
- Level - logging level;
- Robot - robot identifier;
- Portfolio - portfolio name;
- Message - message text.
# 3.2.5. Finres for today
A widget displaying the latest spreads. It allows viewing all spreads for the robot or filtering by a specific portfolio. For a selected portfolio, it is also possible to calculate the average spread over a specified time interval. If you need data for the last 6 months, you should search for it through the Finres history widget.
Spreads included in this widget are formed as follows: when a trade occurs on the first leg, the system attempts to place orders on the instruments of the second leg. The spread is formed and added to the table only after all second-leg orders have been filled or their re-quoting has failed. If second-leg orders were not placed (due to an order submission error or because hedging was not required according to portfolio settings), the spread is formed and added immediately—either upon receiving an order rejection or right after the first-leg trade if no second-leg order was needed. Since spreads are calculated based on trades, and only the first-leg instrument was traded, such spreads are referred to as "one-legged." For this reason, the number of "one-legged" spreads may increase when the Overlay parameter is set to a non-zero value. Trades from balancing orders placed on second-leg instruments do not generate spreads and are not included in this widget.
The average spread is calculated directly from the trades forming the spreads within the specified time interval (not from previously computed spread values). The calculation uses up to 300,000 most recent spreads; if more than 300,000 spreads fall within the interval, only the newest 300,000 are used. When calculating the average spread, volume-weighted average prices of trades for each financial instrument are substituted into the formula used to compute Sell and Buy . Therefore, average spread calculation does not work when Ratio type is set to Ratio formula, when the Trade formula flag is enabled, or when Type trade is set to IV.
The main table of the widget includes the following columns:
- Date/Time - date and time when the last trade in the spread was executed, displayed in the user’s local time according to the device's time zone;
- Robot - robot identifier;
- Portfolio - portfolio name;
- Price - spread value calculated based on trade prices. Due to the robot’s focus on maximum speed, specific exchange connection characteristics, and trade aggregation on certain platforms, instead of the actual trade price, the displayed value may represent the order price, average execution price for the order, or the worst price among trades executed under that order;
- Direction - trading direction for the portfolio (same as the order direction on the first-leg instrument):
BuyorSell; - Sell/Buy - the calculated sell/buy price at the time of placing an order for the Is first financial instrument. The value is entered according to the order direction. When using the clicker, the fields are left empty;
- Lim_S/Lim_B - the signal sell/buy price at the time of placing an order for the Is first financial instrument. The value is entered according to the order direction. When using the clicker, the fields are left empty;
- Quantity - number of portfolios bought or sold;
- SL - flag indicating whether all second-leg orders were filled immediately or had to be re-quoted due to stop-loss or timer.
A yellow highlight in the Price field corresponds to the SL flag being set. The SL flag is provided as a separate column to allow grouping spreads by this field. Such grouping enables separation of spreads into two categories: those where all second-leg orders were filled immediately (no re-quoting occurred), and those where second-leg orders were re-quoted due to timer or stop-loss activation. Hovering over the Price field displays a tooltip containing detailed information about the trades forming the given spread. Fields in the tooltip correspond to those in the Deals for today widget table.
# 3.2.6. Finres history
A widget displaying spreads over a specific time period (up to 100,000 entries). It allows viewing all spreads for the robot or filtering by a specific portfolio. For a selected portfolio, it is also possible to calculate the average spread over a specified time interval. Exporting the table contents to a file is supported. According to the system update of June 22, 2025, the historical data retention period is 6 months.
Spreads included in this widget are formed as follows: when a trade occurs on the first leg, the system attempts to place orders on the instruments of the second leg. The spread is formed and added to the table only after all second-leg orders have been filled or their re-quoting has failed. If second-leg orders were not placed (due to an order submission error or because hedging was not required according to portfolio settings), the spread is formed and added immediately—either upon receiving an order rejection or right after the first-leg trade if no second-leg order was needed. Since spreads are calculated based on trades, and only the first-leg instrument was traded, such spreads are referred to as "one-legged." For this reason, the number of "one-legged" spreads may increase when the Overlay parameter is set to a non-zero value. Trades from balancing orders placed on second-leg instruments do not generate spreads and are not included in this widget.
The average spread is calculated directly from the trades forming the spreads within the specified time interval (not from previously computed spread values). The calculation uses up to 300,000 most recent spreads; if more than 300,000 spreads fall within the interval, only the newest 300,000 are used. When calculating the average spread, volume-weighted average prices of trades for each financial instrument are substituted into the formula used to compute Sell and Buy . Therefore, average spread calculation does not work when Ratio type is set to Ratio formula, when the Trade formula flag is enabled, or when Type trade is set to IV.
The main table of the widget includes the following columns:
- Date/Time - date and time when the last trade in the spread was executed, displayed in the user’s local time according to the device's time zone;
- Robot - robot identifier;
- Portfolio - portfolio name;
- Price - spread value calculated based on trade prices. Due to the robot’s focus on maximum speed, specific exchange connection characteristics, and trade aggregation on certain platforms, instead of the actual trade price, the displayed value may represent the order price, average execution price for the order, or the worst price among trades executed under that order;
- Direction - trading direction for the portfolio (same as the order direction on the first-leg instrument):
BuyorSell; - Sell/Buy - the calculated sell/buy price at the time of placing an order for the Is first financial instrument. The value is entered according to the order direction. When using the clicker, the fields are left empty;
- Lim_S/Lim_B - the signal sell/buy price at the time of placing an order for the Is first financial instrument. The value is entered according to the order direction. When using the clicker, the fields are left empty;
- Quantity - number of portfolios bought or sold;
- SL - flag indicating whether all second-leg orders were filled immediately or had to be re-quoted due to stop-loss or timer.
A yellow highlight in the Price field corresponds to the SL flag being set. The SL flag is provided as a separate column to allow grouping spreads by this field. Such grouping enables separation of spreads into two categories: those where all second-leg orders were filled immediately (no re-quoting occurred), and those where second-leg orders were re-quoted due to timer or stop-loss activation. Hovering over the Price field displays a tooltip containing detailed information about the trades forming the given spread. Fields in the tooltip correspond to those in the Deals for today widget table.
# 3.2.7. Data connections
A widget displaying market data connections. For these connections, actions such as enabling (Enabled), disabling (Disabled), and reconnecting are available. Rarely used connections are hidden by default; to display them, uncheck the Hide extra connections flag in the widget settings.
Non-obvious detail:
The robot does not provide a separate interface for adding market data connections. However, when adding certain transactional connections, it is possible to create market data connections. This behavior exists because some market data connections are not public and require authentication. In our case, such market data connections use the authentication credentials specified during the creation of the trading connection. If a market data connection is created when adding a transactional connection, the two connections are considered linked: disabling one will automatically disable the other. A market data connection created together with a transactional connection will be deleted if the corresponding transactional connection is removed.
The main table of the widget includes the following columns:
- Exchange - name of the exchange, market, or broker (if the connection is a data aggregator from multiple venues provided by a broker);
- Name - name of the connection or its individual data stream (for connections where each data stream appears as a separate row in the connections table);
- Status - status of the connection and its individual streams. Possible statuses:
- "Online" - snapshot requests and other required data have been successfully sent and received; currently, the connection/stream receives and processes updates as they arrive. Stream names in "online" status are displayed on a green background;
- "Connecting" - the connection is being established or requested data (snapshots, order information, etc.) is pending. Stream names in "connecting" status are displayed on a yellow background;
- "Disconnected" - the socket is not connected, and no data is currently being received. Stream names in "disconnected" status are displayed on a red background;
- "Disconnected by time" - the socket is disconnected and no data is being received, but the current time falls outside the exchange/broker’s operating hours, so this state is considered normal. Stream names in "disconnected by time" status are displayed within a green border;
a connection is considered "online" only when all elements in the corresponding cell are online (i.e., shown in green);
- Security manager - a widget for searching instruments and building an instrument list in connections where the full list of instruments is not broadcast.
# 3.2.8. Trade connections
A widget displaying trading (transactional) connections. It allows adding new connections and performing the following actions on existing ones: enabling (Enabled), disabling (Disabled), reconnecting, and modifying connection settings. Current connection settings can be viewed via the same menu item used to edit them.
The main table of the widget includes the following columns:
- Exchange - name of the exchange, market, or broker (if the connection is a data aggregator from multiple venues provided by a broker);
- Name - user-defined name of the connection;
- Trans count - number of trading transactions (order submissions, cancellations, re-quotes) sent through the connection during the day. The value resets daily at 5:40 server time;
- Status - status of the connection and its individual streams. Possible statuses:
- "Online" - snapshot requests and other required data have been successfully sent and received; currently, the connection/stream receives and processes updates as they arrive. Stream names in "online" status are displayed on a green background;
- "Connecting" - the connection is being established or requested data (snapshots, order information, etc.) is pending. Stream names in "connecting" status are displayed on a yellow background;
- "Disconnected" - the socket is not connected, and no data is currently being received. Stream names in "disconnected" status are displayed on a red background;
- "Disconnected by time" - the socket is disconnected and no data is currently being received, but the current time falls outside the exchange/broker’s operating hours, so this state is considered normal. Stream names in "disconnected by time" status are displayed within a green border;
a connection is considered "online" only when all elements in the corresponding cell are online (i.e., shown in green);
- Positions - button that opens the Trade connections positions widget, pre-selected for the relevant connection (unlike opening the widget from the main widgets menu). For connections that do not support this functionality, the button is inactive;
- Orders - button that opens the Trade connections orders widget, pre-selected for the relevant connection (unlike opening the widget from the main widgets menu). For connections that do not support this functionality, the button is inactive.
# 3.2.9. Trade connections orders
A widget displaying active orders for instruments contained in the user’s portfolios, specific to a given robot and trading connection. The displayed orders may have been placed by the current robot or through other means (another robot, via terminal, etc.). Rows corresponding to orders not tracked by the robot are highlighted in yellow. Orders not tracked by the robot include those placed via terminal, placed by another robot, submitted through the order submission mechanism bypassing the algorithm in the Trade connections positions widget, as well as orders "lost" during robot restart if the robot was restarted while orders were still active. Any order shown in this widget can be canceled directly from it.
The widget is not available for all connections. Unsupported connections cannot be selected within the widget.
The main table of the widget includes the following columns::
- SecKey - unique exchange instrument identifier;
- Order number - order number, which in most cases matches the exchange-assigned number, or otherwise contains the exchange number;
- CLOrdId - user-defined order identifier;
- Price - price specified in the order at submission;
- Quantity - quantity specified in the order at submission;
- Amount left - remaining quantity in the order;
- Buy/Sell - order direction:
BuyorSell; - Time - time when the last update for the order was received, displayed in local time according to the device's time zone;
- Cancel order - button to cancel the order.
# 3.2.10. Trade connections positions
A widget displaying current exchange positions by currencies and by instruments (if supported, typically available when trading derivatives). By default, all non-zero instrument positions (even for instruments not included in any portfolio) and positions of instruments that are part of at least one robot portfolio (even if the position is zero) are displayed.
If both currency and instrument positions are available for an exchange, the widget will display two separate tables.
In the instrument positions table, the exchange position for each instrument and the robot's calculated position for that instrument are shown. The robot's position is computed as the sum of positions across all portfolios containing the instrument. Notifications can be configured to alert when these two positions differ.
The instrument positions/limits table includes the following columns:
- SecKey - unique exchange instrument identifier;
- SecCode - instrument symbol on the exchange;
- Pos - exchange position in the instrument;
- Robot pos - robot’s calculated position in the instrument, computed as the sum of positions across all portfolios containing this instrument;
- Mark. price - mark price received from the exchange;
- Liq. price - liquidation price received from the exchange;
- Pos lag - threshold for allowable difference between
PosandRobot pos; the exact behavior is determined by the flags below;; - Check equality - flag; if set, the absolute difference between
PosandRobot posis checked for equality withPos lag, and a notification is issued if they are not equal. If the flag is not set, a notification is issued only if the absolute difference exceedsPos lag; - Tgr notify - flag indicating whether notifications about position mismatches should be sent to Telegram; requires a connected Telegram bot;
- Pos leveling - button that opens a position alignment window. This function allows placing an order "outside" the robot’s algorithm—i.e., such an order will not be tracked by the robot, will not belong to any portfolio, and therefore will not affect the robot’s position calculation. Essentially, placing such an order is equivalent to placing it via an exchange terminal.
The currency positions/limits table includes the following columns:
- Currency - currency name;
- Pos/Limit - exchange position or exchange limit for the currency.
The pair of widgets Trade connections orders and Trade connections positions is designed to partially replace a traditional trading terminal. Therefore, from the instrument positions table in this widget, it is possible to place orders outside the robot’s algorithm (similar to placing an order via a terminal) to align the difference between the exchange position and the robot’s position when they do not match.
The widget is not available for all connections. Unsupported connections cannot be selected in the widget.
# 3.2.11. Deals for today
A widget displaying the most recent trades. It allows viewing all trades for the robot, or filtering by a specific portfolio or a specific financial instrument within a portfolio. This widget includes all trades executed by the robot, except those from orders placed via the Trade connections positions widget. Instrument positions in the portfolio are calculated using the same data source as this table. If you need data for the last 6 months, you should search for it through the Deals history widget.
The main table of the widget includes the following columns:
- Date/Time - trade date and time, displayed in the user’s local time according to the device's time zone;
- oNo - internal order number, which does not always match the exchange-assigned number (for MOEX, the internal number matches the exchange number);
- Portfolio - portfolio name;
- Security - financial instrument name;
- Target price - price of the originally submitted order; this value is shown only for second-leg orders. In case a second-leg order was re-quoted due to stop-loss or timer, this field will always display the price of the very first order in the chain—i.e., the price based on the bid or offer recorded at the moment the first-leg order was placed;
- Price - execution price of the trade. Due to the robot’s focus on maximum speed, specific exchange connection characteristics, and trade aggregation on certain platforms, instead of the actual trade price, the displayed value may represent the order price, average execution price for the order, or the worst price among trades executed under that order;
- Buy/Sell - order direction:
BuyorSell; - Quantity - traded quantity. If the
Aggregatedflag is present, the displayed quantity may differ from the actual quantity in a single terminal trade, as the row marked withAggregatedmay represent an aggregation of several consecutive trades from the same order; - Curpos - position in the portfolio’s instrument after processing this trade;
- Connection - trading connection through which the order leading to this trade was submitted;
- Aggregated - flag indicating that the displayed trade may actually be an aggregation of multiple individual trades.
# 3.2.12. Deals history
A widget displaying trades over a specified time period (up to 100,000 entries). It allows viewing all trades for the robot, or filtering by a specific portfolio or a specific financial instrument within a portfolio. This widget includes all trades executed by the robot, except those from orders placed via the Trade connections positions widget. Instrument positions in the portfolio are calculated using the same data source as this table. Exporting the table contents to a file is supported. According to the system update of June 22, 2025, the historical data retention period is 6 months.
The main table of the widget includes the following columns:
- Date/Time - trade date and time, displayed in the user’s local time according to the device's time zone;
- oNo - internal order number, which does not always match the exchange-assigned number (for MOEX, the internal number matches the exchange number);
- Portfolio - portfolio name;
- Security - financial instrument name;
- Target price - price of the originally submitted order; this value is shown only for second-leg orders. In case a second-leg order was re-quoted due to stop-loss or timer, this field will always display the price of the very first order in the chain—i.e., the price based on the bid or offer recorded at the moment the first-leg order was placed;
- Price - execution price of the trade. Due to the robot’s focus on maximum speed, specific exchange connection characteristics, and trade aggregation on certain platforms, instead of the actual trade price, the displayed value may represent the order price, average execution price for the order, or the worst price among trades executed under that order;
- Buy/Sell - order direction:
BuyorSell; - Quantity - traded quantity. If the
Aggregatedflag is present, the displayed quantity may differ from the actual quantity in a single terminal trade, as the row marked withAggregatedmay represent an aggregation of several consecutive trades from the same order; - Curpos - position in the portfolio’s instrument after processing this trade;
- Connection - trading connection through which the order leading to this trade was submitted;
- Aggregated - flag indicating that the displayed trade may actually be an aggregation of multiple individual trades.
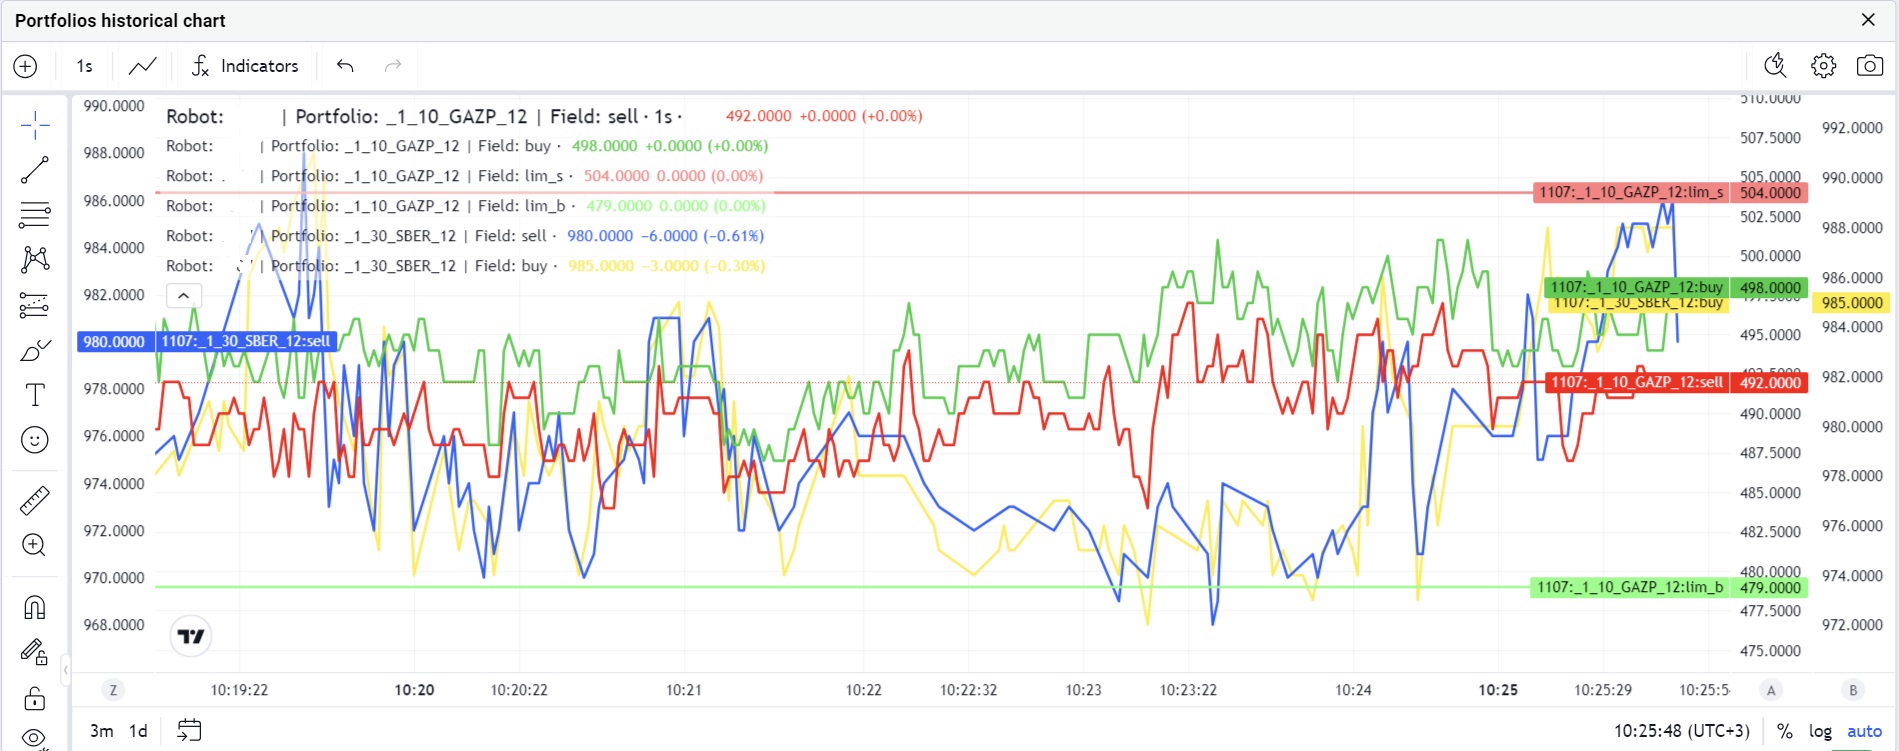
# 3.2.13. Portfolios historical chart
This widget can be opened for portfolios where parameter history recording is enabled. To open the widget, click the ![]() icon in the
icon in the Chart column of the Portfolios table widget, on the row corresponding to the desired portfolio. The chart opens with pre-set indicators: portfolio parameters Sell, Buy, Lim_sell and Lim_buy. These parameters can be removed or replaced. History recording is controlled by the user via the Save history setting in the schedule on the Timetable tab in portfolio settings. The chart displays data for the selected period, and historical data is loaded progressively when scrolling rightward, back to the point when history recording began. For MOEX markets, it is recommended to follow the market schedule to avoid informational gaps in the history. There is a limit on the number of portfolios for which history recording is available. By default, this limit is 3 portfolios. To request an increase, please contact technical support. The limit exists due to system resources required for storing and processing historical portfolio data. Increasing the limit beyond reasonable values may either be restricted or made a paid feature.
The chart supports multiple time frames, selectable in the upper-left corner. Selected indicators can be removed, and additional ones can be added from the dropdown list containing any user portfolio’s available parameters. Additional instruments can be added using the "+" button in the upper-left corner. The full list of available fields can be viewed in the Field field, as shown in Figure 8.
.b87cb3e1.jpg) |
|---|
| Fig. 8 |
The main instrument is always present on the chart and cannot be deleted; it can only be changed via the instrument selection menu on the Main tab.
It is possible to add multiple portfolios (with history recording enabled) to a single chart. Maximum history duration is 3 months; beyond that, older data is gradually overwritten starting from the earliest entries.
Note that chart data is saved approximately 3 times per second—the frequency at which the robot sends updates. Therefore, if multiple values occur within 0.3 seconds, only the most recent one will be displayed on the chart. No averaging over 0.3 seconds is performed.
# 3.2.14. Portfolios realtime chart
This widget can be opened for portfolios where parameter history recording is not enabled. The chart opens with pre-set indicators: portfolio parameters Sell, Buy, Lim_sell and Lim_buy. It is not possible to change or add other indicators. The chart time frame cannot be modified. Chart rendering begins from the moment the widget is opened. Chart data is not preserved after page reload. This is a simplified version of the charts, representing a compromise between the ability to display real-time data and system resource limitations.
Note that chart data represents periodic snapshots of real-time parameter values used by the robot. Data updates are sent by the robot approximately 3 times per second; therefore, if multiple values occur within 0.3 seconds, only the most recent value will be displayed on the chart. No averaging over 0.3 seconds is performed
# 3.3. Other User Interface Elements
# 3.3.1. Status Panel
 |
|---|
| Fig. 9 |
On the top right side of the website interface, there is a robot status indicator panel (Figure 9). If no issues are detected (all robots are connected to the robot control server, and all trading and market data connections are online), the first icon will appear as shown in Figure 9. The next icon reflects the connection status between the user interface in the browser and the robot control server; if the connection is lost, the icon will be crossed out. Next is Moscow time, derived from the user's computer time converted to the Moscow time zone. To the right is a connectivity stability indicator showing the round-trip time for the last message sent to the server and its response. A traffic-light-style color code allows quick assessment of connection quality without needing to interpret numerical values.
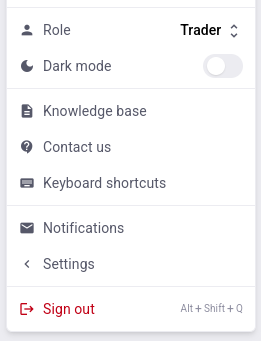
# 3.3.2. Settings Behind the User Icon
 |
|---|
| Fig. 10 |
Clicking the user icon in the top-right corner of the page opens the menu shown in Figure 10. From this menu, users can perform the following actions:
- Switch to another available role.
- Change the site theme between light and dark mode.
- Access a link to this user guide.
- View the technical support contact information for the platform.
- View the list of keyboard shortcuts specific to our website interface. Standard keyboard shortcuts remain functional:
Escclose windows or exit table cell editing without saving;Enteropen cell editor, or exit and save changes;Ctrl+Ccopy value;Ctrl+Vpaste value;F2open cell editor;Tabnavigate between widget elements; and others. - Open the notifications inbox.
- Enable or disable two-factor authentication, view the list of trusted devices (where second-factor confirmation is not required), and remove unwanted devices.
- Perform basic Telegram notification setup, including initial Telegram bot connection by entering your Telegram ID in this menu.
- Generate an API key and access the API tester.
- Adjust the frequency of updates delivered to the user interface (changing the default may only be useful on low-performance devices experiencing interface lag).
- Terminate the current session and log out.